A rate and an interval tell different stories
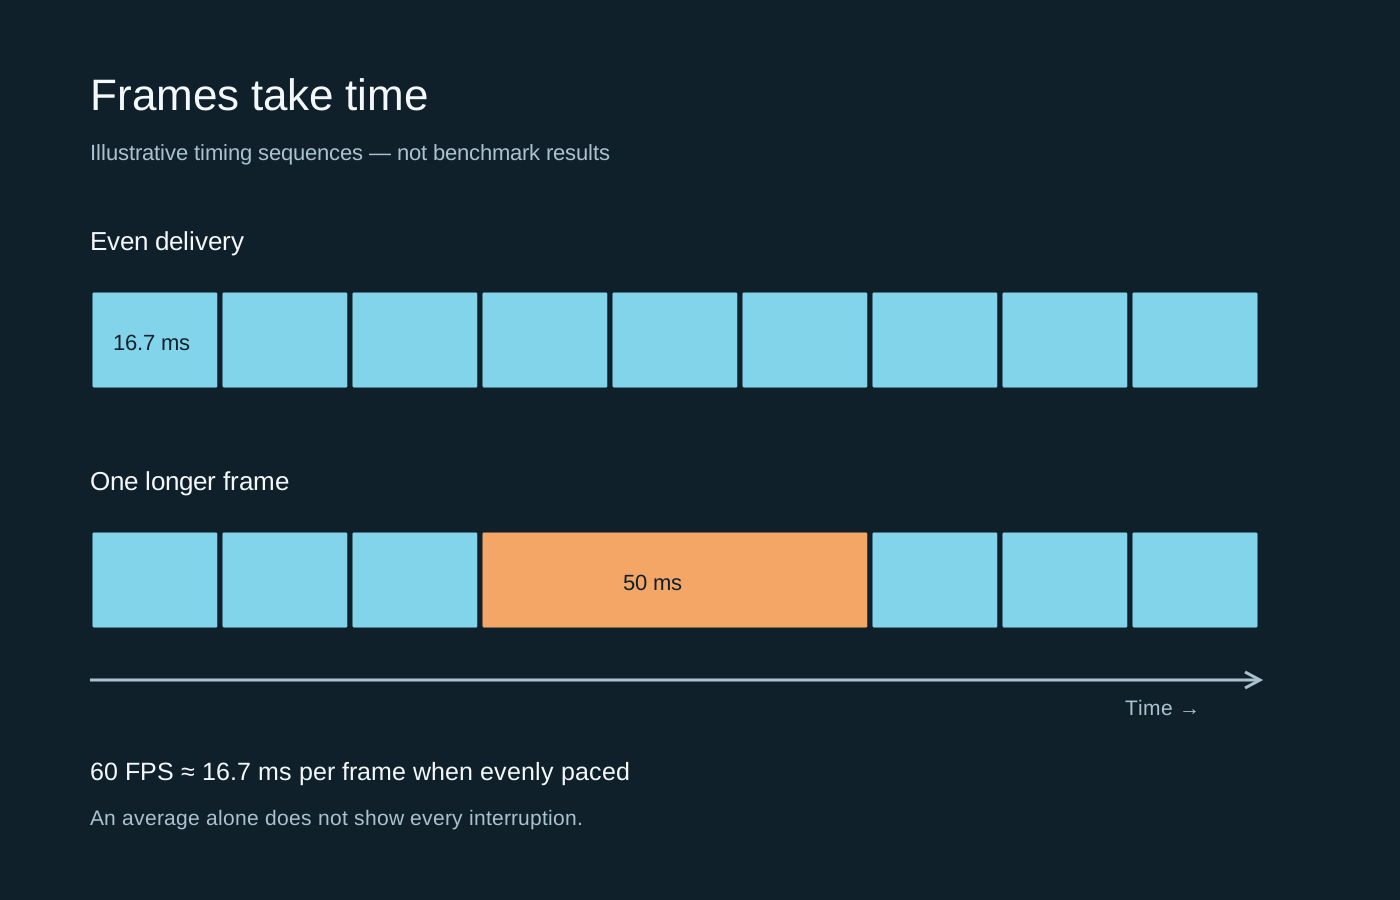
Frames per second describes how many frames occur over a period. Frame time describes an interval associated with individual frames. When frames arrive evenly, 60 per second corresponds to about 16.7 milliseconds between them; 120 corresponds to about 8.3 milliseconds. These are arithmetic relationships, not a promise about how any particular game will behave.
Now imagine a sequence that usually advances regularly but occasionally pauses for much longer. Its average FPS can still look respectable across a long sample. The pause is nevertheless noticeable. A graph of the individual intervals makes that unevenness easier to locate than a single average number does. The illustration on this page is synthetic, not a benchmark from a tested computer.
Check which interval the tool measures
Performance tools do not necessarily attach the same meaning to every frame-related label. A game can spend time doing CPU work, waiting on a GPU, presenting an image and waiting for display. Some tools expose several stages separately. Intel’s PresentMon documentation describes frame-event analysis and hardware telemetry, which is useful context when deciding which metric to record.
Read the explanation for the selected counter rather than treating every value ending in milliseconds as interchangeable. In particular, a frame-time reading is not automatically complete input-to-display latency. A smooth plot does not establish that every part of the input path is quick. Likewise, a generated-frame mode can change the displayed frame count without making all other timing measures equivalent.
Capture a repeatable section
Choose a short route, replay or built-in benchmark that you can run again. Note the game version, resolution, graphics settings, frame cap and whether any upscaling or frame generation is enabled. Keep the same monitoring setup for the comparison. Opening several overlays at once adds complexity without necessarily providing more useful evidence.
Separate loading screens, menus and ordinary play when interpreting a capture. A long interval while loading a new area has a different context from repeated pauses during a predictable movement. Mark where a hitch occurred and what you were doing, then check whether it appears on another comparable run. A one-off spike should not be promoted into a diagnosis of a failing component.
Use the pattern to choose the next check
If the problem repeats, change one relevant variable and record another run. For example, compare a lower rendering workload while leaving the route and other settings unchanged. That is a controlled comparison, not a guarantee that the graphics card caused the original issue. Background activity, compilation, streaming assets and other stages may still need investigation.
Keep averages together with the graph and a description of how the test was performed. Low-percentile figures can add context, but their calculation depends on the tool and sample. Compare like with like. The purpose of the record is to show whether a change improves the experience you observed, not to collect the most flattering number.